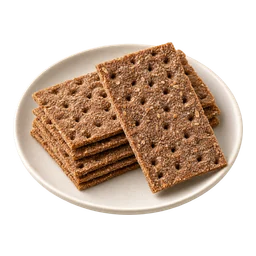
Rye crispbread
Grains, bread & pasta
Also known as crispbread, wasa, crackers, knäckebrot
High in sodium
Rye crispbread has 366 kcal and 7.9 g protein per 100 g, with 82 g carbs and 1.3 g fat. One crispbread (10 g) has 37 kcal and 0.8 g protein.
- Calories per 100 g
- 366kcal
- Protein per 100 g
- 7.9g
- Carbs per 100 g
- 82g
- Fat per 100 g
- 1.3g
Per 100 g.
Nutrition facts
| Per 100 g | Per crispbread (10 g) | |
|---|---|---|
| Calories | 366 kcal | 37 kcal |
| Protein | 7.9 g | 0.8 g |
| Carbohydrates | 82 g | 8.2 g |
| Sugar | 1.1 g | 0.1 g |
| Fiber | 17 g | 1.7 g |
| Fat | 1.3 g | 0.1 g |
| Saturated fat | 0.2 g | 0 g |
| Unsaturated fat | 0.7 g | 0.1 g |
| Sodium | 460 mg | 46 mg |
| Cholesterol | 0 mg | 0 mg |
| Potassium | 319 mg | 32 mg |
| Calcium | 31 mg | 3.1 mg |
| Iron | 2.4 mg | 0.2 mg |
“High” marks 20% or more of the FDA daily value in 100 g, the threshold nutrition labels use. It applies to saturated fat, sodium and cholesterol, which are limits rather than targets.
Where the calories come from
- 8%Protein
- 89%Carbs
- 3%Fat
2.2 g protein per 100 kcal
Track it in Vytal, free
Log by weight, portion or photo and see it against calorie and protein targets built for you.
More grains, bread & pasta
Typical reference values from public food composition databases. Brands, recipes and preparation vary, so a packaged product’s label is the better source for that product. Where these numbers come from